MySQL 101: Troubleshooting MySQL with Percona Monitoring and Management

 Percona Monitoring and Management (PMM) is a free and open source platform for managing and monitoring MySQL, MongoDB, and PostgreSQL databases. In this blog, we will look at troubleshooting MySQL issues and performance bottlenecks with the help of PMM.
We can start troubleshooting MySQL after selecting the appropriate server or cluster from the PMM dashboard. There are many aspects to check which should get priority depending on the issue you are facing.
Things to look at:
OS:
Check to see if there is a spike or gradual increase in the CPU usage on the database server other than the normal pattern. If so, you can check the timeframe of the spike or starting point of the increasing load and review the database connections/thread details from the MySQL dashboard for that time interval.

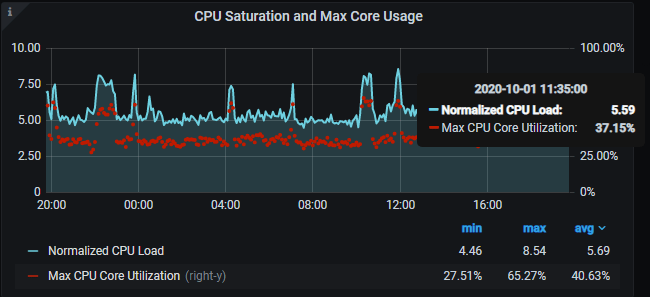
CPU Saturation Metrics and Max Core Usage:
This is an important metric as it shows the saturation level of the CPU with normalized CPU load. Normalized CPU Load is very helpful for understanding when the CPU is overloaded. An overloaded CPU causes response times to increase and performance to degrade.

Disk latency/ Disk IO utilization:
Check to see if there is any latency observed for the disk. If you see the Disk IO utilization reach 100%, this will cause latency in queries as Disk would not be able to perform the read/writes, causing a gradual pile up of queries and hence the spike. The issue might be with the underlying disk or hardware.

Any sudden change in memory usage consumption could indicate some process hogging the memory, for example, the Mysql process, if many concurrent queries or any long-running queries are in progress. We can see any increase when any backup job or a scheduled batch job is in progress on the server as well.
Check the Inbound and Outbound Network traffic for the duration of the issue for any sudden dip which would point to some network problems.
MySQL:
MySQL Client Thread Activity / MySQL Connections:
If the issue at hand is for a large number of running threads or a connection spike, you can check the graphs of MySQL Connections and MySQL thread activity and get the timeframe when these connections start increasing. More details about the threads (or queries running) can be seen from Innodb dashboards. As mentioned previously, a spike in Disk IO utilization reaching 100% can also cause connections to pile up. Hence, it is important to check all aspects before coming to any conclusion.

If there were queries that were performing slow, this would be reported in the MySQL slow queries graph. This could be due to old queries performing slowly due to multiple concurrent queries, underlying disk load, or newly introduced queries that need analysis and optimization. Look at the timeframe involved and further check the slow logs and QAN to get the exact queries.

If there were a large number of users or threads unable to establish a connection to the server this would be reported by a spike in aborted connections.
InnoDB Metrics:
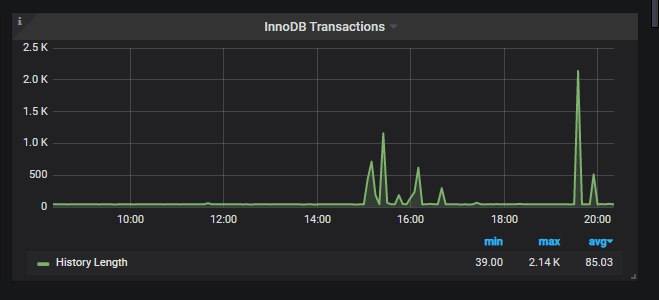
This metric will show the graph of History List Length on the server, which is basically ‘undo logs’ created to keep a consistent state of data for any particular connection. An increase in HLL over time is caused due to long-running transactions on the server. If you see a gradual increase in HLL, look at your server and check show engine innodb status\G. Look for the culprit query/transaction and try to kill it if it’s not truly needed. While not an immediate issue, an increase in HLL can hamper the performance of a server if the value is in the millions and still increasing.

When you see a spike in thread activity, you should check here next to get more details about the threads running. Spike in reads/inserts/deletes? You will get details about each of the row operations and their count, which will help you understand what kind of queries were running on the server and find the particular job that is responsible for this.

InnoDb Locking > InnoDB Row Lock Time:
Row Lock Waits indicates how many times a transaction waited on a row lock per second. Row Lock Wait Load is a rolling 5 minute average of Row Lock Waits. Average Row Lock Wait Time is the row lock wait time divided by the number of row locks.

InnoDB Logging > InnoDB Log file usage Hourly:
If there is an increase in writes on the server, we can see an increase in the log file usage hourly and it would show the size in GB on how much data was written to the ib_logfiles before being sent to disk.
Performance Schema Details:
This dashboard will provide details on the wait IO for various events as shown in the image:

Similar to events, this will display the load corresponding to the event.
QAN:
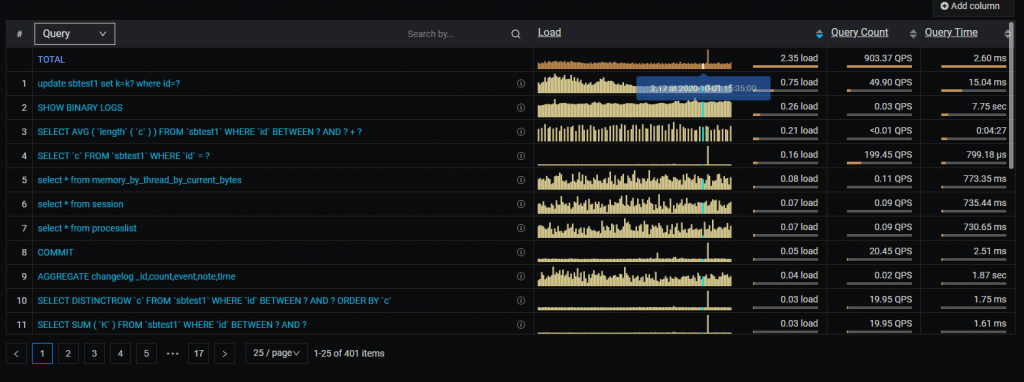
The Query Analytics dashboard shows how queries are executed and where they spend their time. To get more information out of QAN you should have QAN prerequisites enabled. Select the timeframe and check for the slow queries that caused most of the load. Most probably these are the queries that you need to optimize to avoid any further issues.

Daniel’s blog on How to find query slowdowns using PMM will help you troubleshoot better with QAN.
For more details on MySQL Troubleshooting and Performance Optimizations, you can check our CEO Peter Zaitsev’s webinar on MySQL Troubleshooting and Performance Optimization with PMM.
by Rituja Borse via Percona Database Performance Blog
Comments
Post a Comment