Running Security Threat Tool In Percona Monitoring and Management For the First Time

 As we have just released the new Security Threat Tool (STT) as part of Percona Monitoring and Management (PMM) 2.6, I wanted to give you a basic overview of this new feature. Its goal is to advise PMM users on common security-related database problems they might have on their databases.
In this blog, I’ll show you how to activate this feature, see its results, and highlight some of the high-level architectural design.
How to Install PMM
First, you need to install or upgrade your PMM client and server. Here’s a basic example of installing PMM2 for the first time.
If you already have PMM2 installed, you need to follow the update process to upgrade your PMM server using Docker or by using the Update Button.
In this blog post, I’ll do a short installation of the Docker version of PMM2 and Packages.
Start PMM Server as Docker container
# docker create -v /srv --name pmm-data percona/pmm-server:2 /bin/true
# docker run -d -p 80:80 -p 443:443 --volumes-from pmm-data --name pmm-server --restart always percona/pmm-server:2

This is your basic setup when PMM monitors only itself
Next, you need to install the pmm2-client package and configure PMM client-side.In my case :
# pmm-admin config   --server-insecure-tls --server-url=https://user:pass@x.x.x.x:443

Checking local pmm-agent status...
pmm-agent is running.
Registering pmm-agent on PMM Server...
Registered.
Configuration file /usr/local/percona/pmm2/config/pmm-agent.yaml updated.
Reloading pmm-agent configuration...
Configuration reloaded.
Checking local pmm-agent status...
pmm-agent is running.
This will add your node to your monitoring setup (for me the name of the node is autodetected: mysql-s-1vcpu-1gb-fra1-01)

Adding my node to monitoring is now complete.
Note: PMM can monitor remote nodes. We always recommend installing the pmm2-client and configuring pmm on the node where you have your database running. This will provide greater insights about your database and will allow you to use different monitoring methods (Slowlog is not available for remote monitoring).
Start Database Monitoring
Next, I’m going to start monitoring my MySQL server.
# pmm-admin  add mysql MyMySQL --environment=STT-demo   --username=pmm  --password=pmm

MySQL Service added.
Service ID  : /service_id/87ec3b4f-f193-4778-a2d1-56495a76f3aa
Service name: MyMySQL

Table statistics collection enabled (the limit is 1000, the actual table count is 308).
In the previously mentioned blog post, you can also find examples of how to set up other databases for monitoring by PMM.
Let’s check whether our MySQL server is now being monitored. Open PMM Server and you can see it on the dashboard.

Activate Security Threat Tool
For the initial release, we are not activating the Security Threat tool by default, so you need to activate it manually (opt-in). Go to the settings page (PMM -> PMM Settings), switch the toggle for Security Threat Tool (STT), and apply the changes you’ve just made.

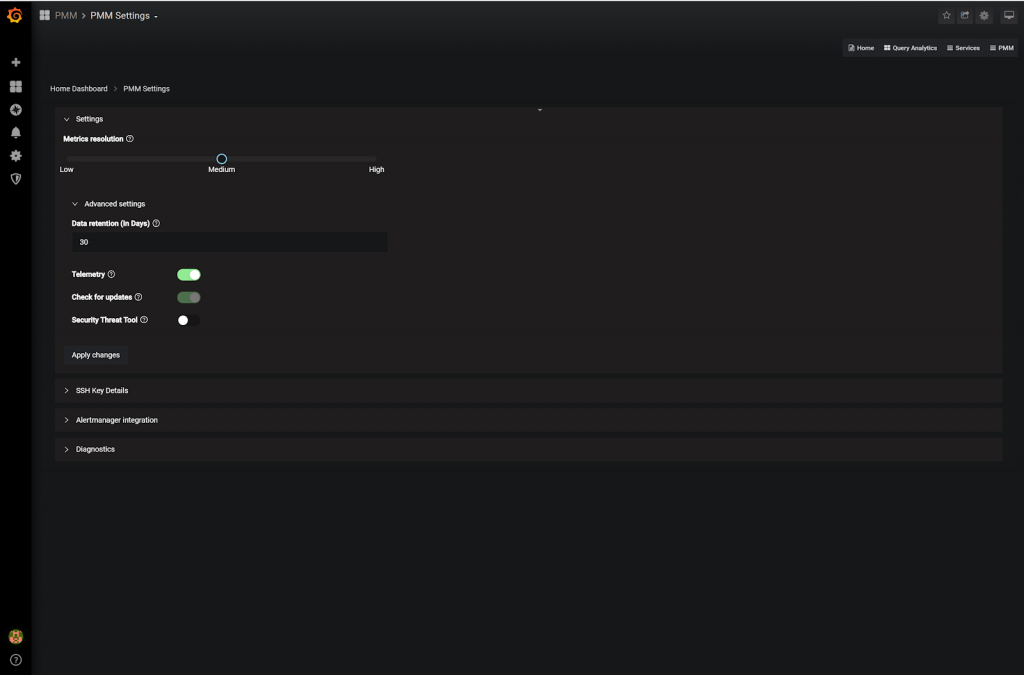
From this moment STT will start working.
Please note: STT will interact with Percona’s internal infrastructure. This means, in order to get checks it is not possible to have Telemetry disabled and STT enabled. For more details please see related blog posts on PMM data collection practices and PMM adoption.
Wait
For the initial release (PMM 2.6.0), we execute checks only once a day. Future features include the ability to run checks more frequently as well as the ability to manage scheduling intervals.
This is why, after you activate STT, you need to wait for the first run. For an initial installation, this will be connected with our telemetry timeout which is 24 hours.
See Results
After some period of time, checks will be downloaded from Percona and executed. If the Checks service finds problems in your environment, it will generate alerts for the user. The Security Alerts will be visible only for Admin users, no users with Viewers level will see them.
For now, there are two places where you can see information about any failed checks.
- The first place to look for checks is your PMM Home Page.

The Panel is presenting a total number of failed checks and by clicking it will lead you to a separate page with a list of all failed checks in your environment.
- The Separate page, accessible from the menu. By clicking on the home page panel, you are presented with more extended information about the failed checks.

Currently, STT will get 2 groups of checks:
- Check about the latest versions for Mysql, MariaDB, MongoDB, and PostgreSQL. These checks are generating separate alerts for each Service about the latest available version of the corresponding DB. The recommended action here will be to update your database to the latest recommended (NOTE: not necessarily the latest available)
- STT will check your MySQL Database against users with empty passwords and tell you about them. You need to set the password and this will improve your security.
This is all about running STT for now, but future checks will be delivered to your PMM2 server automatically, without additional Server updates. We’ll be sure to blog about new security checks as they come out, so check back regularly to see what’s new.
by Roma Novikov via Percona Database Performance Blog
Comments
Post a Comment