MySQL Performance Optimization with Percona Monitoring and Management – Webinar Followup

 Last week I did a webinar on MySQL Troubleshooting and Performance Optimization with Percona Monitoring And Management v2 (PMM2).
There was a tremendous amount of interest and many more questions than I could answer, so I’m answering them in this blog post instead.
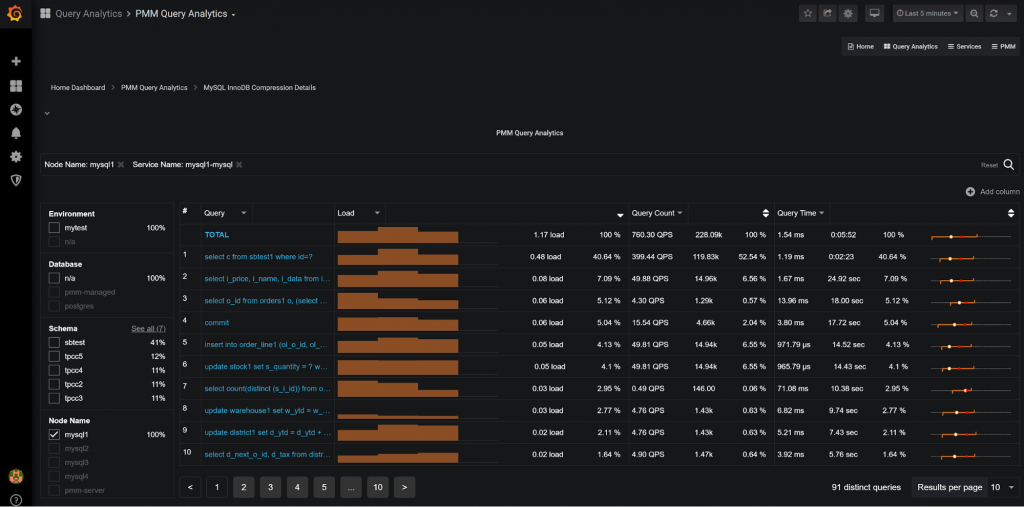
Q: What are the red and white dots on the last column in PMM Query Analytics?

This is a graphical visualization of the query response time variance; we see minimum query response time and maximum query response time as the ends of the orange line. The white line shows the average response time and the red dot estimates 99 percent response time. This feature allows us to visually see the variance of a given query execution; if the orange bar is short all query executions take a similar amount of time, and if it is long, as in this example, the variance is large. You can see exact numbers with mouseover (in this case, taking anywhere from less than 0.1ms to 55sec to execute – this is quite a range!).
Q: Where can I find information about the integration with ClickHouse?
Stay tuned. I’m planning to write a couple of blog posts about it. For now, I think this webinar will help you to get started
Q: Can you send the queries you are using?
I’m planning to write a separate blog post about using Clickhouse directly with Percona Monitoring and Management and I will share queries in it.
Q: Using PMM can we determine the optimal Redo logfile size for performance?
Percona Monitoring and Management does not give advice on what optimal Redo Log Size is, but the “Innodb Details” dashboard is there to help you. In the very top the dashboard you will see this image:

If this number does not exceed 50-60 percent over the last 24 hours, you would not likely benefit from the larger redo log file. If you’re looking for more detailed information, check out “Innodb Checkpointing and Flushing” section in the same dashboard and you will see this graph:

If the orange line is pushing close to the red line, the Redo log file is too small for your workload to be run efficiently. I would strive for not exceeding 50 percent of your log file space use as a good Redo log size, but also keep in mind a larger Redo log file means longer crash recovery time.
Q: Can these views be set to a very recent time frame, like the most recent 5 minutes, or a recent hour? And, how quickly are the newest data/measures refreshed?
If you look at the query information it is captured in one-minute intervals (buckets), and with additional propagation delay, I would expect up to two minutes lag. Operational metrics are often available with just a few seconds of delay. Here is a view showing Query Data for the last five minutes:
Q: Hi, is (there) a way to check the blocked queries and blocking queries during a window whether the read/writes went into lock state?
You can see how many queries are spent in the locked state but you do not know which query or queries have been causing that wait.

Showing which queries caused the row-level lock wait is not easy as often it may not be one query which is “guilty” but rather, many queries interacting. It may not be a “query” at all, but a transaction having locked rows waiting on the application side. This is an important problem and we will look into solving it in the future.
Q: Can you summarize what Redis/Memcache would look like (if at all) in PMM2?
Percona Monitoring and Management v2 only supports monitoring of MySQL (and MariaDB), PostgreSQL, and MongoDB at this point. Redis and Memcached monitoring are not currently supported. The plan is to enable adding support for their monitoring in PMM2 through the support of External Exporters as was supported in PMM v1. This feature is already in development. And in the more distant future, through some sort of extension/plugin interface allowing to implement query information capture for technologies not supported by PMM out of the box.
Q: How much load does PMM have on DB?
Q: Is this tool to be used on production servers? Or on staging/debug server?
Q: Any recommendation on not making it kill the instance or add too much load on the instance we are monitoring?
These similar questions I thought are best answered together. The design goal for PMM is to have no more than 1 percent overhead in normal circumstances, so you can safely run it in production.
Having said that, it is best practice to run Percona Monitoring and Management in production as well as in your development and staging QA environments. If the development team can find bad queries, bad schema, or other mistakes before pushing them to production, it is the best outcome.
You never catch all bad queries though, and even if you do there are cases when “good queries” behave badly due to some problems with statistics or other operational issues. To catch these and resolve problems quickly you need to run PMM in production.
In some exceptional cases, PMM may generate more than the target 1 percent of the load. In this case, you can configure resolution, as lower resolution means lower load.
You also disable Table Statistics if you have a large number of tables. Run pmm-admin add mysql –help for details. In general, “Do No Harm” is the primary objective for Percona Monitoring and Management, so if you’re observing PMM negatively impacting your database performance in any way, please let us know by filing a bug.
Q: Is it able to detect/recommend config changes to better tweak the parameters based on the server resources, ex.: cache, innodb_buffer_pool_*,?
Percona Monitoring and Management does not give you direct advice right now, but this is in the plans. All server variables (like innodb_buffer_pool) are regularly collected so you can often see if the value changes in various dashboards.
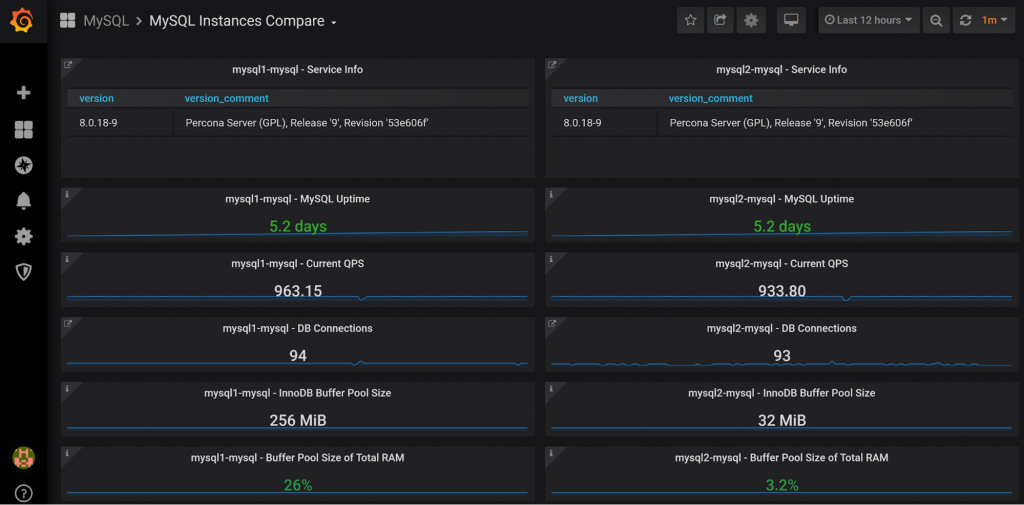
One of the “advanced” things you can do is to compare this value among different servers in the Advanced Data Exploration Dashboard:

In this case, I see three servers having a buffer pool size of 256MB and one only 32MB, for some reason. I can also compare the instances to see if there are any differences between them:
Q: How could one correlate running queries with deadlocks and IO operations? It looks like the stats can’t be grouped using custom rules.
This question is not completely clear to me, so I’ll just show what PMM2 can do. If you’re looking for top queries based on the lock waits or disk IO, you can do that:

Changing the Lead column to “InnoDB IO Read Wait” will show the queries which are the most commonly blocked on the disk IO. You can also sort by amount for the read IO query is doing. We can’t attribute write IO directly to queries so it is not available.
Q: Is there a way to monitor what’s currently being executed in MySQL DB? Also, SQLs that are executed in a particular time frame (like History Data)?
Right now, there is no feature to see currently running queries (like SHOW PROCESSLIST) but you can view the history of the queries for any period of time. Just use the calendar in the top right corner:

Q: Where do we can find “Transaction History Length” details?
Look into the MySQL Innodb Details -> Innodb Undo Space and Purging section:

The highlight – maximum Transaction History Length is also available right at the top of that dashboard.
![]()
Q: Is there documentation to upgrade from PMM 1.0 to 2.0?
There is no support for an in-place upgrade from PMM 1.0 to PMM 2.0. Instead, what you usually would do is set up PMM2 agent to run concurrently with PMM1 until the time you have enough data in PMM2 to switch over.
I understand it is not ideal but significant data structure changes in PMM2 made conversion rather impractical.
Q: Can we monitor MongoDB without having root access on the host to install client?
Yes. You do not have to run the “agent” at the same host as the database, you can set the agent to monitor remote instance, but in this case, you will not have access to the Operating System level metrics, but only those which the database server provides. (This last limitation does not apply to Amazon RDS and Aurora monitoring due to CloudWatch integration).
Q: Is there still SSL restriction to monitor Postgres RDS in AWS?
No, this restriction has been lifted in PMM2. Note, Amazon RDS for PostgreSQL does not yet support integration with CloudWatch metrics. This feature will be added in the future PMM2 release.
Q: Is there anything that PMM can do while VividCortex can not?
This is a hard question to answer as both PMM and VividCortex are constantly adding new features. The most important difference is that you roll your own version of Percona Monitoring and Management, which means it can be used in secure environments where sending even sanitized queries into the cloud is not acceptable. This also gives you much more cost controls.
Because PMM is open source and built on Grafana and Prometheus, there are many more extension possibilities for advanced users.
In-depth query analyses is another feature that we’re particularly proud of in PMM, for example, you can zoom in on queries which are run by a particular user from a particular hostname at a particular schema with PMM:

Q: Is it advisable to install PMM in the same server as the database and is it heavy?
In a typical production environment, it is not recommended, but in a development environment, it is quite a common setup. To monitor a single database server, PMM would need very little CPU (less than 5 percent of a single CPU core) and 1GB of RAM will be enough.
Q: It has so many graphs so which one is most helpful and how often should we be viewing PMM from a daily point of view?
Yes. The number of graphs in PMM can be intimidating; we built Percona Monitoring and Management in part for the Percona team to be able to resolve the most complicated problems, so it goes into a lot of detail.
The most important dashboards would be the Query Analytics and also dashboards available from “Home Dashboard”:

You can click on the CPU usage, for example, to see the system overview or database connections or QPS to get the MySQL overview dashboard. These should be enough to identify 90 percent of the most typical issues.
We are continuing our work on usability to make Percona Monitoring and Management simpler and easier to use.
Q: Any particular reason external:service are skipped in PMM2? We use them for other datastore monitoring and we’re stuck with PMM 1 because of this.
External exporter support is planned. PMM2 was a major re-write and more than a simple addition to PMM1, and some features have not been re-implemented yet. External exporters is one of such features.
Q: Is there any documentation on how to create custom dashboards and are there any other dashboards which are already pre-made and can be imported into PMM if not shipped out of the box
Percona Monitoring and Management uses Grafana Engine for dashboards so you can use Grafana Documentation for creating dashboards in PMM.
by Peter Zaitsev via Percona Database Performance Blog
Comments
Post a Comment